"You are serving a customer, not a life sentence. Learn how to enjoy your work."~ Laurie McIntosh
And you can only enjoy your work, if you know what your customers want from you. In other words, KNOW YOUR CUSTOMERS.
As Steve Jobs said, "Get closer than ever to your customers. So close that you tell them what they need well before they realize it themselves."
Most of your customers are expecting higher standards from the brands because, they have been 'spoiled' by best-in-class user experiences — both on- and off-line with companies such as Amazon and Apple, empowered by the profusion of data points – "customers increasingly expect companies to respond swiftly to inquiries, to customize products and services seamlessly, and to provide easy access to the information customers need, when they need it."
The customer experience is the NEW competitive battle FiELD
HENCE, THE NEED FOR A CUSTOMER JOURNEY MAP AND WE KNOW attendee activities during a conference or a trade show can yield generous amounts of data points about individual interests — the sessions attended, the exhibit booths visited, social media postings and likes/dislikes, information requests/downloads and mobile polling/survey responses — all can be clever indicators to start tracking your customer journey and reap glorious ROI benefits.
If you are an exhibitor, big or small, avail the technology to personalize the journey of your customers as they frantically move amongst various screen channels and devices.
THE CONFLUENCE OF DATA AND DESIGN
START BY TRACKING THE DATA POINTS. HERE ARE FEW OF THEM
Registration data including name, title, company, sessions of interest, registration survey responses
Industry Survey Responses
Mobile Polling and Mobile app data: Every touch on an app can be trackable.
Visitors/Prospects in your space: Wearable beacons technology (small radio transmitters worn on a badge or lanyard) can track exhibit booth dwell time (the booths each attendee visited and how long they visited).
Sessions attended: Beacons or other radio frequency identification technology can be used to accomplish this.
Social media sentiment analysis: Tools that can measure social media activity and sentiments express around an event hashtag
Audience engagement tools such as Educational Measures Array technology can provide very rich detail on specific presentations and knowledge transfer.
Heatmaps of crowd flow through an exhibit hall and elsewhere (accomplished via beacon technology)
Course notes, and relevant product information downloaded from your website
NOW THAT YOU HAVE DERIVED THE DATA, DESIGN YOUR CUSTOMER JOURNEY. USE YOUR TRADE SHOW INVESTMENT DOLLARS TO MAP OUT THEIR JOURNEY
We have used this customer journey map from adobe.com as a guideline
|
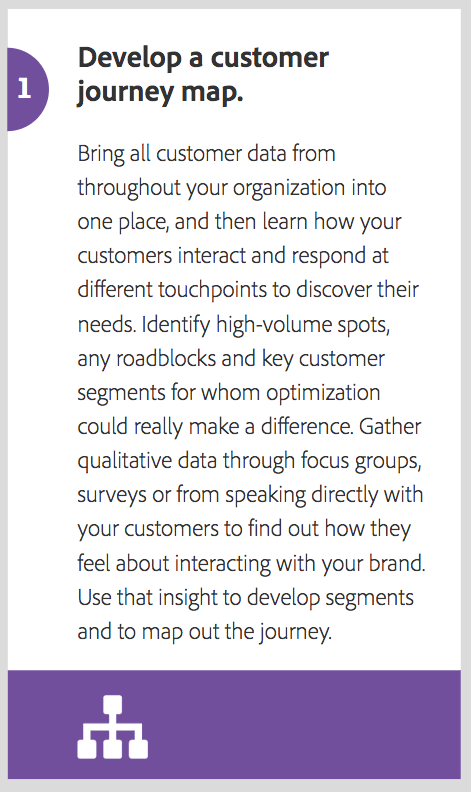
Start with your high value customers and learn how they interact at the different levels of touch points.
Use qualitative data by directly talking to them at trade shows. On follow up e-mails add UTM tags to campaign URLs via Google’s Campaign URL builder. You later use Google Analytics to determine which email follow-ups from the different trade shows resulted in sales, leads, most time on site, or other key performance indicators. At a trade show chances are you will be dealing with the boss of your existing customer. His pain points will be different than your direct customer. This gives you a detailed picture to draw up your customer journey map. |
|
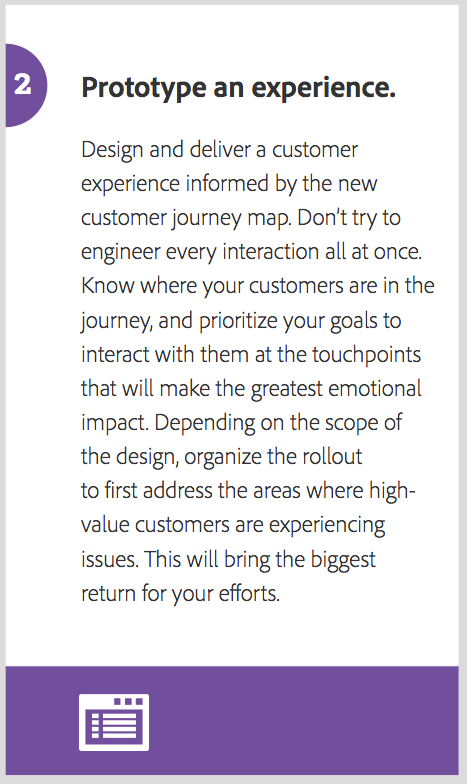
Designing a targeted customer journey map is a daunting task. Hence, prioritize your goals to interact with them at the touch points that will make the greatest emotional pay off. Keep this in mind when you design your next face to face encounter. Design your exhibit to address the areas where your high value customers are experiencing obstacles. |
|
|
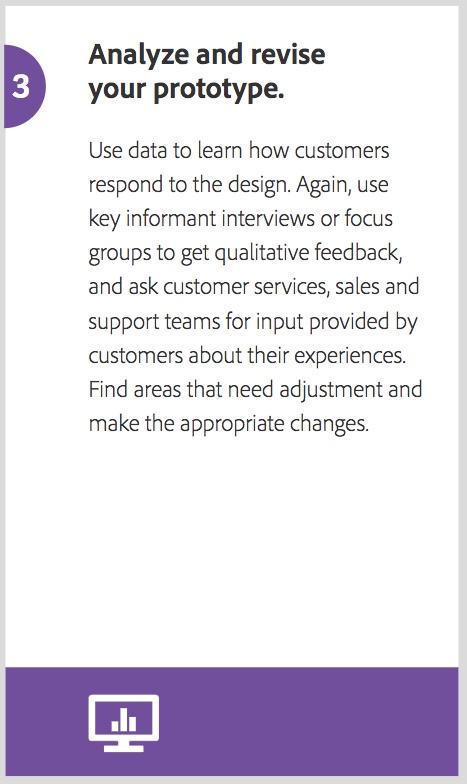
Design your booth that is conducive to hold meetings and focus groups in your booth space to consistently refine the data that you have collected. Exhibit at lateral shows to get more data on your customers and your prospects. Secure the technology to tie in the data from the different shows in real time. |
|
Ongoing optimization includes pre-show, post-show and at-show interaction. Make special show offers targeted towards the low conversion rates. Pay attention to the repeat web visits and make it a point to reward those visitors at the show -- be it, in their absence. Because, the act of doing this enriches our collective wisdom, thus fostering connected individuals. |
|
|
Your audience is now responsible for their audiences. Blippy is described as a network, where the users discover new products and good deals while connecting with their friends. "From the user perspective, it's just a stream of cool stuff that your friends are buying." However, from the the business perspective, it's the ultimate word-of-mouth marketing: "I buy something and tell all my friends about it." Now, think what you can do or give away at the show venue that will create the ultimate world-of-mouth scalability in your marketing efforts. |
THE CUSTOMER JOURNEY IS A CONTINUAL WORK IN PROGRESS. WITH THE RAPID CHANGE IN TECHNOLOGY IT NEEDS TO BE CONSISTENTLY TWEAKED
A customer journey map can be simple or rather complicated depending the number of touch points that you have. "The more touchpoints you have, the more complicated — but necessary — such a map becomes. Sometimes customer journey maps are “cradle to grave,” looking at the entire arc of engagement." If you are new at this, and you do have a schedule for exhibiting at tradeshows, then use your venue to start the "arc of engagement".
For starters, re-orient your mindset to devise a different set of goals for your trade shows. Learn about the industry segment that your customers belong to. Conduct electronic customer surveys before they visit you at the booth. Personalize the visit based on the survey and create a design that connects your customers with your product experience.
IMPORTANT KEY PERFORMANCE INDICATORS THAT WILL HELP YOU TRACK YOUR CUSTOMER JOURNEY MAP
1. Event marketing analytics
E-mail Open Rates, Delivery Rate, Click through rates
Conversions - E-mail click to registration or Landing Page
Social Media Shares and E-mail Forwards
2. Booth Display Effectiveness (attendance, booth visits, leads captured)
3. Social media engagement (hashtag mentions/reach, social sentiment analysis, Instagram postings, Twitter posts, Snapchat posts, Face book postings etc.)
4. Attendee satisfaction surveys (by trade show venue, by session, by speakers)
5. Repeat attendees by category (attendees/exhibitors)
6. Cost-to-revenue ratio per attendee and by each trade show venue
7. Cost per attendee acquisition
8. Overall Session Attendance Compared to Previous Year and Compare to Registration Sales
9. Registration sales compared to previous trade shows
10. Attendee engagement "(measured in many ways including percentage of app downloads, percentage of survey responses, live response polling rate, sponsorship responses, response to speaker slides, level of interaction with meeting content, percentage of gamification uses)"
There is no single right way to create a customer journey, and your own BRAND will need to DEVISE A MAP THAT WORKS BEST FOR YOUR SPECIFIED situation
The framework layed out here is designed to help you start thinking at better understanding the journey that your "customers travel through as they engage with your company, brand, products, partners, and people."
No doubt, drawing up your customer journey can be a daunting affair. Darin Hicks, CEO of Hive9, shares 4 points for marketers to own budget and be masters of the marketing process. We think that these four processes are great stimulators for drawing up your customer journey as well.
1. Understand your historical performance of your data: Know at a high-level what has worked and not worked.
2. Understand the dimension of time: For example, if your organization has a six-month sales cycle, driving new leads in the second half of the year won’t contributeto your current-year revenue.
3. Highlight the trends: Know the soft trends and the hard trends of your industry and know the difference between them. If something’s been declining the past two years, and you are devoting budget towards it, it will not reap the rewards, that it had done before. Instead, start experimenting with the hard trends because, that gives you the ability to see disruptions before they happen and the insight we need to create strategies based on a new level of certainty.
4. Look forward, not just backward: Know how everything is supposed to happen through the year, such as when leads will come as a result of marketing activities. Model a forward-looking view that predicts revenue.
"The old way was cost management; the new way is driving business transformation and accelerating growth."
Happy Exploring!